Boards and analyses, right inside adtribute
Any metric, split by any dimension, as a table, a trend or KPIs, on boards your whole team shares. Organizations get them one at a time, and we let you know when yours are ready.
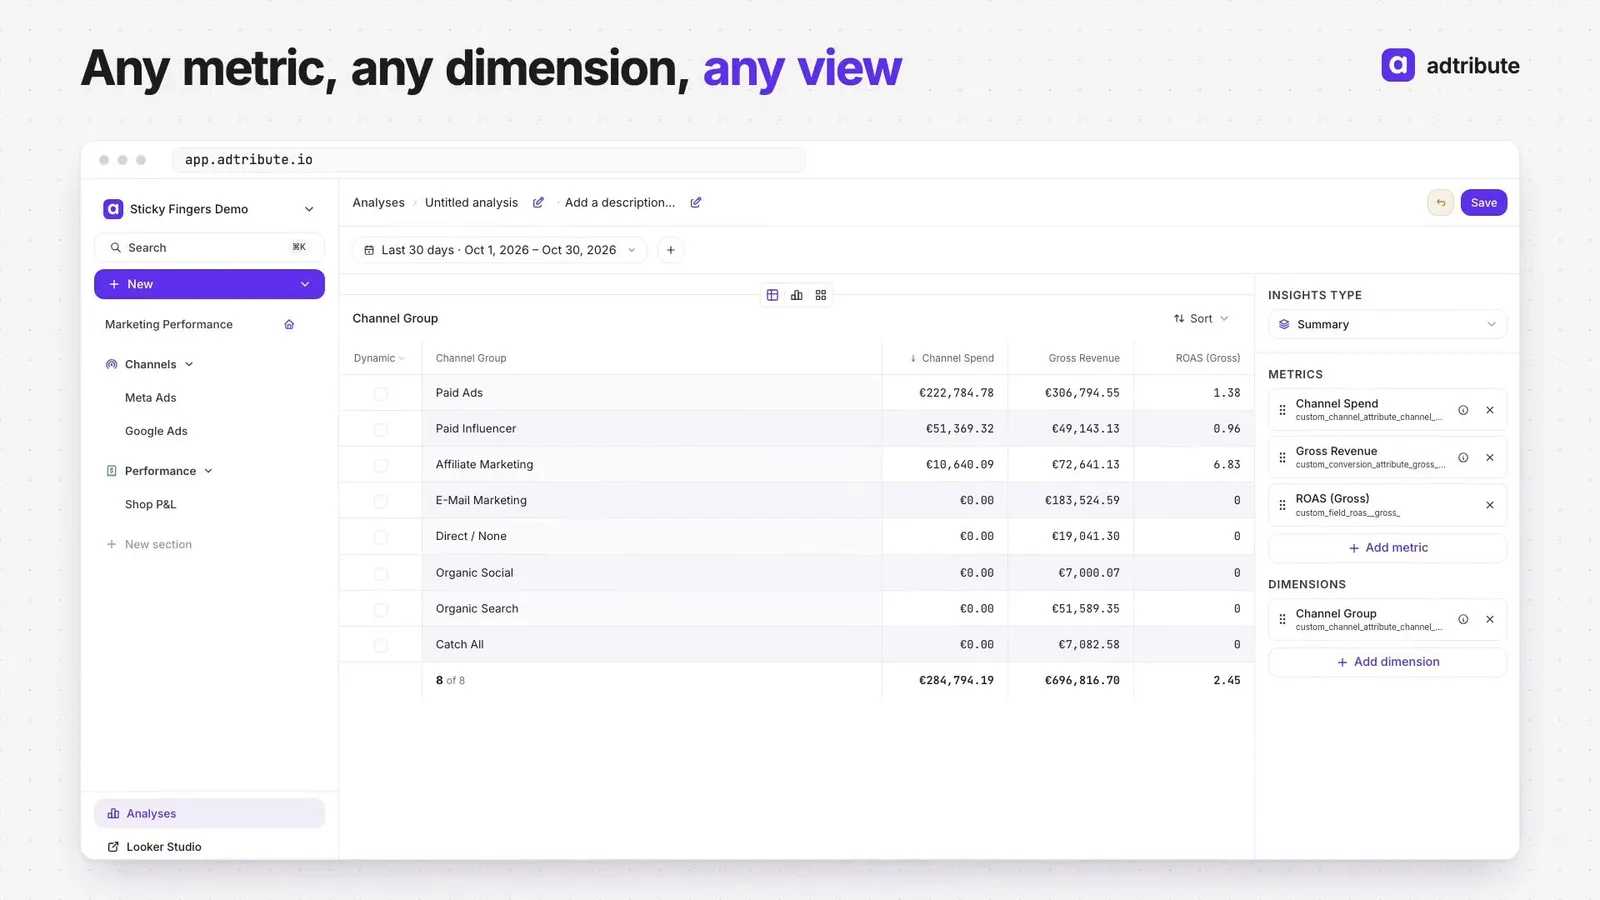
New
Analyses
Pick metrics from your definitions and split them by any dimension. A summary adds up a period; a trend shows how your numbers move by day, week or month. Show it as a table, a chart, lines or columns, or KPIs.
Boards
Add an analysis as a tile in three steps, drag it into place, and save. Every tile stays linked to its analysis: change the analysis once, and every board that uses it updates.
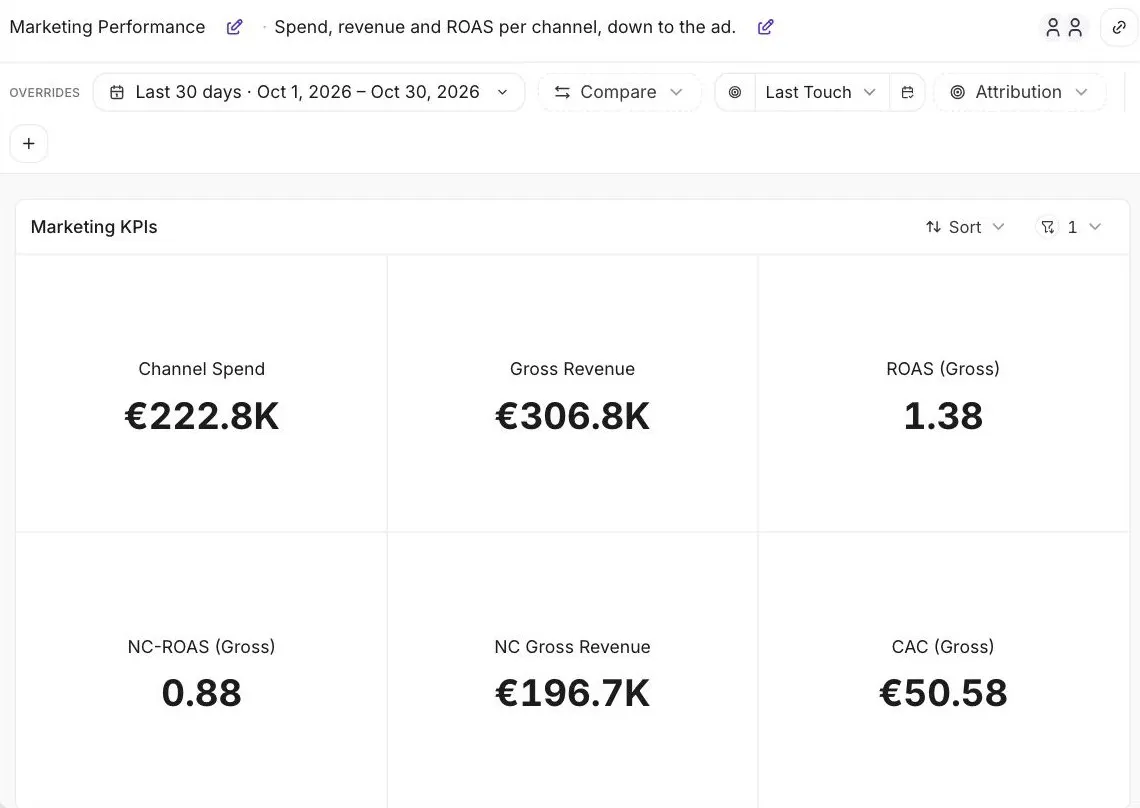
Toolbars
An analysis sets its date range, comparison, attribution model, breakdown and filters. On a board, the toolbar overrides the date range, comparison and model of every tile, and its filters add to each tile’s own. Two attribution models fit side by side in one table.

Drill-down and click date
Click any row, and the whole board follows. Switch any model from conversion date to click date.
Explore and share
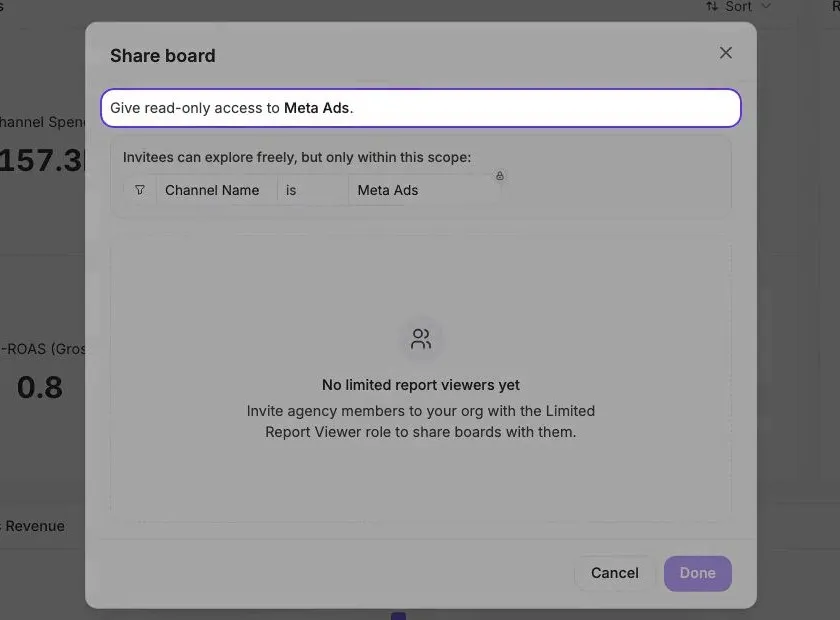
Your changes live in the link, so a reload keeps your view and a colleague sees what you see. Only Save changes the board for everyone. Share a board with your team, or read-only with your agency.
Navigation
Boards sit in sections on the left, your home board opens after login, and ⌘K jumps to any board.
Improvements
- Looker Studio: your Looker Studio reports are rebuilt as boards, in the same sections. Journey, funnel and cohort reports stay in Looker Studio, one click away under Analyses.
Availability
Boards and analyses come to organizations one at a time, as we rebuild each one’s reports as boards. We let you know when yours are ready.